An entity-relationship (ER) diagram is a picture of the data a system keeps: the entities it stores records about, the attributes of each entity, and the relationships between them, including how many of one can be linked to how many of the other. In a relational database the entities become tables, the attributes become columns and the relationships become foreign keys, which is why an ER diagram is the fastest way to understand a schema you did not write.
The three building blocks#
Every ER diagram, whatever the notation, is made of the same three things.
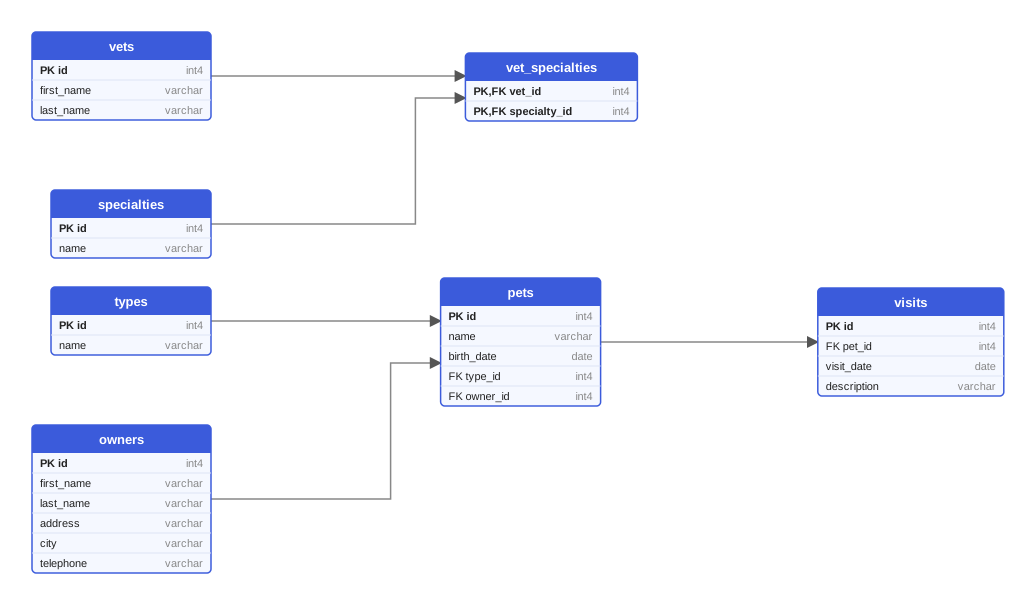
Entities are the kinds of things you keep records about. In the PetClinic schema used throughout this article, the entities are owners, pets, pet types, vets, specialties and visits. An entity is drawn as a box, and each row in the corresponding table is one instance of it: one owner, one pet.
Attributes are the facts you store about an entity. An owner has a first name, a last name, an address, a city and a telephone number. One or more attributes identify an instance uniquely; that set is the entity's key, and in a physical schema it becomes the primary key, usually a single id column.
Relationships connect entities. A pet belongs to an owner, a pet has a type, a visit is made by a pet, a vet has specialties. In a relational schema a relationship is implemented by a foreign key: the pets table carries an owner_id column that holds the key of the owner.
Cardinality: how many of each#
Cardinality states how many instances on one side of a relationship can be linked to one instance on the other side. There are three shapes.
- One-to-many is the everyday case. One owner has many pets; each pet has exactly one owner. The foreign key sits on the "many" side, so
pets.owner_idreferencesowners.id. - Many-to-many cannot be stored with a single foreign key, because a vet has several specialties and a specialty is held by several vets. It needs a third table,
vet_specialties, with one foreign key to each side. Such join tables are covered in detail in Many-to-many relationships and join tables. - One-to-one is rare and usually a design choice: splitting a wide table, or keeping optional data in a separate table. It is implemented as a foreign key that is also unique, often the primary key of the dependent table.
Closely related is optionality, sometimes called participation: must an instance take part in the relationship at all? Every pet in PetClinic must have an owner and a type, so owner_id and type_id are declared NOT NULL. If the schema allowed a pet of unknown type, type_id would be nullable, and a nullable foreign key is exactly how a schema says "optional". Together, cardinality and optionality give the four familiar readings: zero or one, exactly one, zero or more, one or more.
The notations you will meet#
Several drawing conventions exist, and teams often mix them without noticing. The four below cover almost everything in the wild.
| Notation | Entities and attributes | Relationships | Where you see it |
|---|---|---|---|
| Chen | Rectangles for entities, ovals for attributes | Diamonds on the line, with 1, N or M next to each end | Textbooks, academic modeling |
| Crow's foot (Information Engineering) | A box with the attributes listed inside | Line ends carry symbols: a ring for zero, a bar for one, a three-pronged "crow's foot" for many | Most modeling tools and database IDEs |
| UML class diagram | Class box with attributes and types | Association lines with multiplicities such as 1 or 0..* | Teams that already model in UML |
| IDEF1X | Box with key attributes above a horizontal line | Solid lines for identifying relationships, dashed for non-identifying, a dot at the child end | Government and large-enterprise standards |
Generated diagrams tend to be plainer than any of these. A diagram produced from a live schema usually draws each table as a box with its columns and types, marks primary and foreign keys, and connects tables with a labeled arrow. That is enough to read cardinality: the arrow always runs between a primary key and the foreign key that references it, and the foreign-key side is the "many" side.
Conceptual, logical and physical models#
The same schema can be drawn at three levels of detail, and confusion about which level a diagram shows causes most arguments about it.
Conceptual#
Entities and relationships only, named in business language, with no keys and no types. "An owner has pets. A pet visits the clinic." The audience is anyone involved in the product. A conceptual diagram fits on a whiteboard photo and is the right artifact for early design discussions.
Logical#
Attributes appear, keys are identified, many-to-many relationships are resolved into join tables and the structure is normalized. The model is still independent of any database engine: an attribute is "a date", not DATE or datetime2. This is the level at which normalization is decided.
Physical#
Tables, columns with engine-specific types, nullability, primary keys, foreign keys and indexes, exactly as they exist in one database engine. A physical diagram of PetClinic on PostgreSQL shows int4 and varchar; the same schema on Oracle shows NUMBER and VARCHAR2 and folds unquoted names to OWNERS and PETS. Any diagram generated from a database, or from the migrations that build it, is a physical diagram.
What belongs in an ER diagram, and what does not#
An ER diagram earns its place by being readable. Include the things that determine structure and leave out what only adds noise.
- Include: every table, its columns, the primary key, every foreign key with the column it lives in, and at the physical level the column types. Nullability is worth showing when the tool can do it.
- Leave out: indexes, triggers, stored procedures, permissions, and data. They matter, but they belong in a data dictionary or in the DDL, not in the picture. Views are a judgment call; most teams keep them out of the main diagram.
- Split large schemas by subject area. A diagram of two hundred tables is a poster, not a document. Draw the ordering subsystem, the catalog and the accounts separately, and show the handful of tables that connect them in each.
One more rule that saves time: the diagram should be generated, not drawn, whenever it describes a schema that already exists. A hand-drawn diagram is right on the day it is drawn and drifts from then on. Reading a generated schema diagram takes a few minutes once you know the conventions.
Reading the PetClinic diagram#
The figure above is a physical diagram of PetClinic on PostgreSQL. Each box is a table; the bold first rows marked PK are primary keys; rows marked FK hold foreign keys. Each arrow is labeled with the foreign-key column and points from the referenced table to the table that holds the reference, so the arrow labeled owner_id runs from owners to pets: one owner, many pets. The vet_specialties table has two arrows coming in and a two-column primary key, which is the signature of a many-to-many relationship. The visits table points at pets only, so a visit is made by one pet and a pet can have many visits.
Seven tables, five relationships, and the whole domain is on one screen. That is what an ER diagram is for.
Where SchemaDrawer fits#
SchemaDrawer produces physical ER diagrams like the one above from migration files. You upload the migrations of a project written for Flyway, Liquibase, Prisma, Django or one of the other supported tools, pick a database engine and version, and the migrations really run in Docker against a throw-away database; the schema is then read back and rendered as an SVG with tables, columns, primary keys and foreign keys. It draws the physical level only, and it does not draw views, indexes or data. It is free to use through the HTTP API and the GitHub Action; the getting started guide has the two commands it takes, and the examples show diagrams of the same schema on several engines.
Key takeaways#
- An ER diagram shows entities, attributes and relationships; in a database these are tables, columns and foreign keys.
- Cardinality (one or many) and optionality (nullable or not) are read at the ends of the lines; the foreign key always sits on the many side.
- Chen, crow's foot, UML and IDEF1X differ in symbols, not in meaning; generated diagrams use a plainer labeled-arrow style.
- Know which level you are looking at: conceptual for discussion, logical for design, physical for what the database actually contains.
- Generate diagrams of existing schemas instead of drawing them, and split large schemas by subject area.